In general, most database administrators sometimes face a few common problems. One of those issues is optimizing the performance of queries – whenever query optimization is mentioned, the chances are that you will often see some advice regarding indexes. Today we will try to see why indexes are so essential and dive into how to monitor your database indexes’ performance with dbWatch.

What are Database Indexes?
In the database world, indexes are data structures that are frequently used to improve the speed of data retrieval operations. Indexes make data retrieval operations faster because when indexes are in use, databases can quickly locate data without having to scan through every row in a database table every time it’s accessed. The usage of indexes, of course, has both its upsides and downsides – we will start from the good things, then go into the minuses, and finally, we will tell you how to monitor the performance of your database indexes using dbWatch.
Advantages and Disadvantages of Using Database Indexes
There are a few main benefits of using database indexes as long as databases are concerned. We will use MySQL as an example. In this relational database management system, among other things, indexes can be used to:
- Quickly and efficiently find rows matching a
WHEREclause. - Retrieve rows from other tables in
JOINoperations. - Save disk I/O when values are retrieved straight from the index structure.
However, we mustn’t forget that what has advantages probably has disadvantages too. Here are the disadvantages of using indexes in MySQL:
- Your data will consume more space than usual.
- Indexes degrade the performance of certain types of queries in MySQL –
INSERT,UPDATE, andDELETEqueries can be significantly slower on indexed columns. When data is updated, the index needs to be updated together with it. - You may use redundant indexes (e.g., indexing the same column multiple times with different types of indexes).
Monitoring the Performance of Indexes Using dbWatch
To monitor the performance of your database indexes using dbWatch, you can utilize a couple of methods outlined below:
- dbWatch allows you to see your database growth rates through specific jobs. These jobs show aggregated and detailed growth rates for your databases.
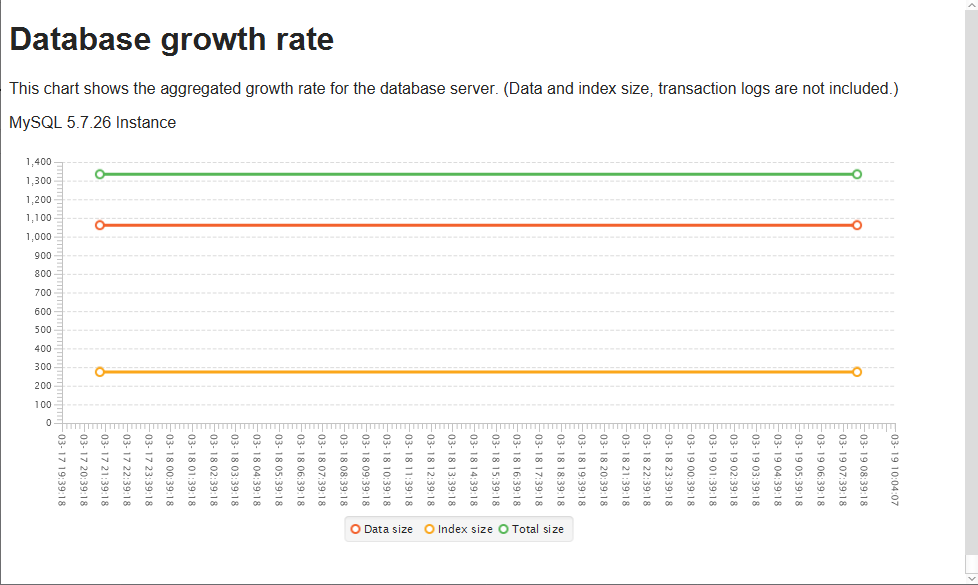
The red line depicts the data size, the orange is for index size, and the green one is reserved for the total size. By observing aggregated growth rates, you can easily see the data and index size, letting you decide whether your indexes are becoming redundant.
Here’s how the detailed growth rates look like:
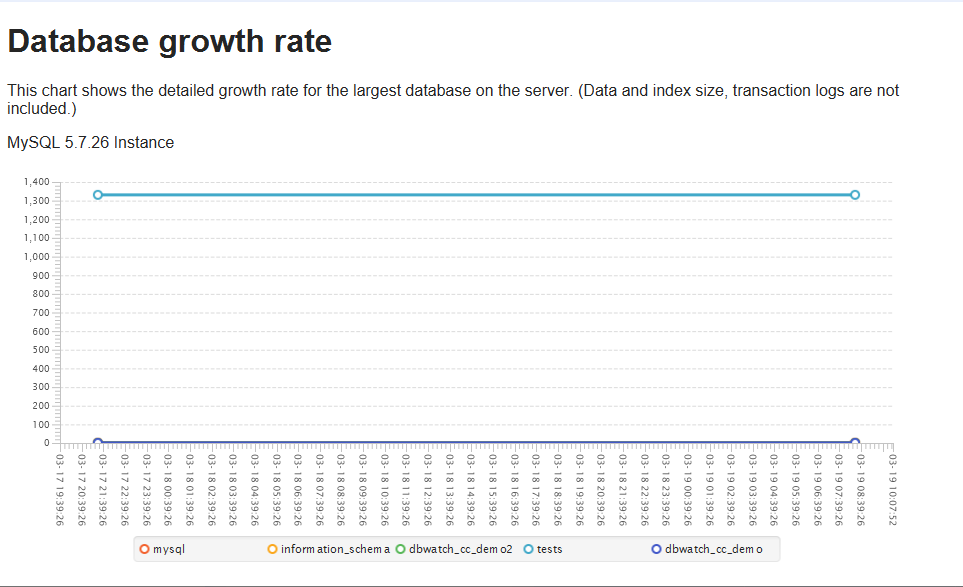
Detailed growth rates show a chart detailing the growth rate for the most extensive databases on the server. These jobs also display dates, letting you observe how your database grew over time.
If your indexes’ size is very small, it might be time to look into a different optimization method. On the other hand, if the size of your indexes is a bit bigger, indexes can become the primary reason your queries run efficiently. It all depends on the index – indexes are critical for good performance, but people often misunderstand them, so indexing can cause more hassle than it’s worth too. To get the best out of the indexes that are in use in your database management system, you can also utilize the InnoDB buffer pool checking job or the MyISAM key buffer checking job – these jobs can give you an excellent indication of the buffer pool utilization in InnoDB or the key buffer utilization in MyISAM.
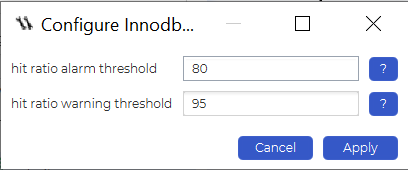
The InnoDB buffer pool check job can be configured to give an alarm or a warning if the buffer utilization exceeds a certain value in percent, allowing you to keep an eye on the buffer pool at all times – since the buffer pool is maintained primarily for caching data and indexes in memory, monitoring its performance can be a crucial aspect of monitoring the performance of your database indexes with dbWatch:
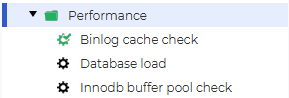
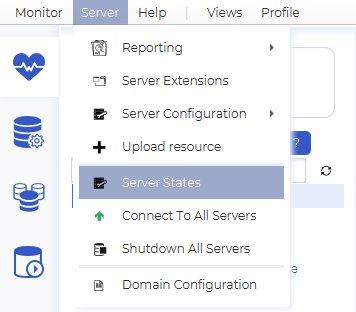
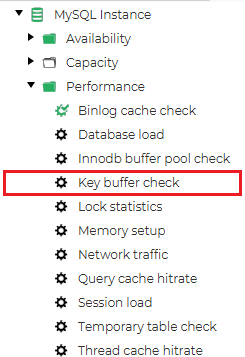
The same can be said about the MyISAM key buffer check job. Once again, this job can be found by simply looking to the dbWatch Control Center’s left side. All that’s left to do is to configure and enable it for it to work:
When configuring the job, keep in mind that there are a couple more parameters that you can use:
- You can choose the number of days you want to keep the data for – after a specified amount of days has passed, data will be discarded.
- The job can give you an alarm or a warning if the buffer utilization exceeds certain specified values in percent.
- The job can give you an alarm or a warning if the read ratio exceeds certain specified values in percent.
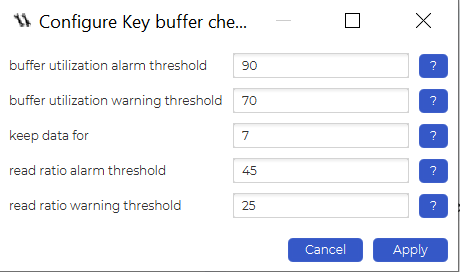
The key buffer utilization alarms can be beneficial not only if you want to know whether the indexes you use in MyISAM are effective or not but also if you want to know when to upgrade your database instances or servers that you usually use to run the database instances on (e.g., if a buffer utilization threshold constantly exceeds, say, 90%, it might be time to look for how you can push your resources further to accommodate the data and indexes that you use).