

Checking the status of database servers is a daily task for nearly every database administrator. By utilizing proper monitoring techniques, you can ensure your databases always perform at their best. In this blog, we explain how to do that with dbWatch.

Why Should You Check the Status of Your Database Servers?
Checking your database servers’ status is essential to improve performance and ensure they remain efficient. It allows you to identify potential issues, such as slow-running queries, missing indexes, or capacity constraints. These insights can help you decide when to move to a new server or adjust configurations. While many tools can assist, we focus on dbWatch.
Why Should You Use dbWatch?
dbWatch is a scalable software solution that helps enterprise customers monitor and manage both small and large numbers of database servers efficiently. It provides total control over their operation, performance, and resource usage. Supporting platforms such as MSSQL, Oracle, PostgreSQL, Sybase, and MySQL, dbWatch is built by leading database experts in Norway to solve database management challenges quickly.
Checking the Status of Your Database Servers with dbWatch
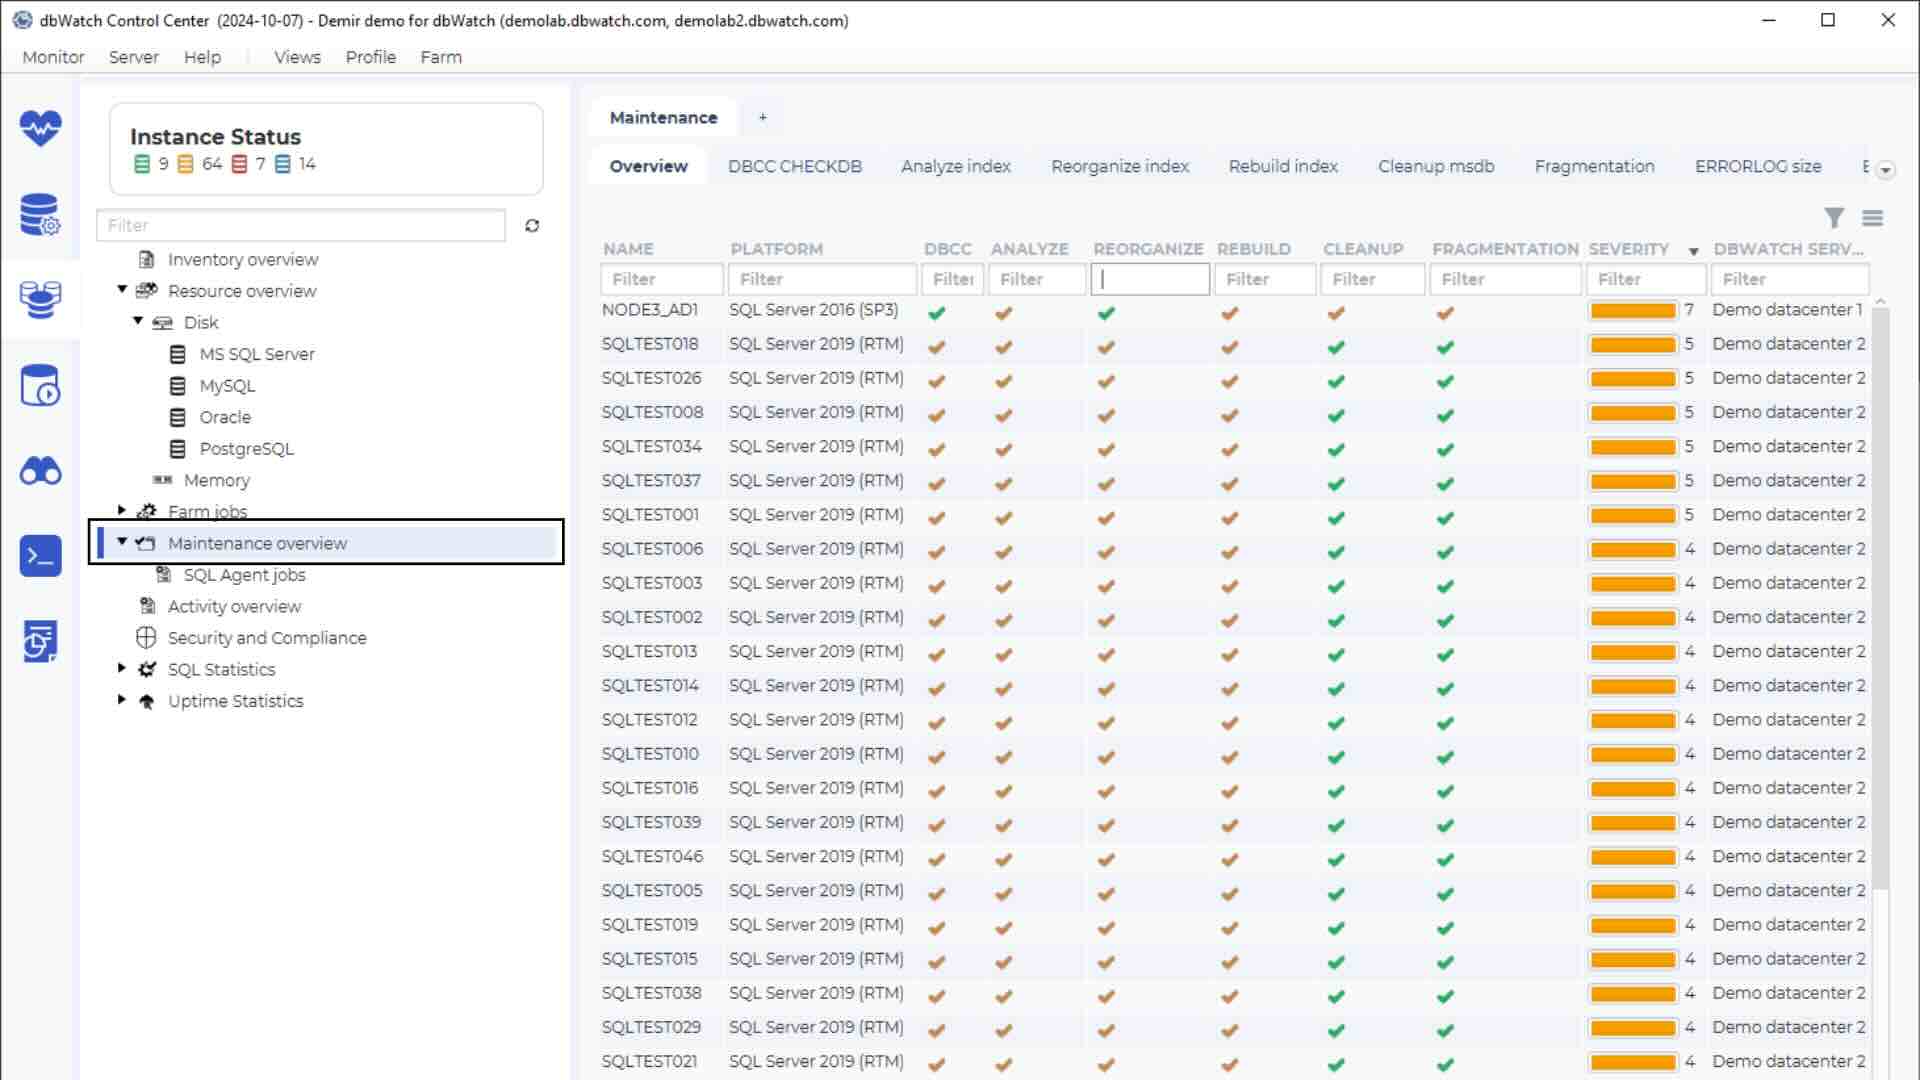
To check the status of your database servers, open dbWatch and view the database status in the monitoring module:
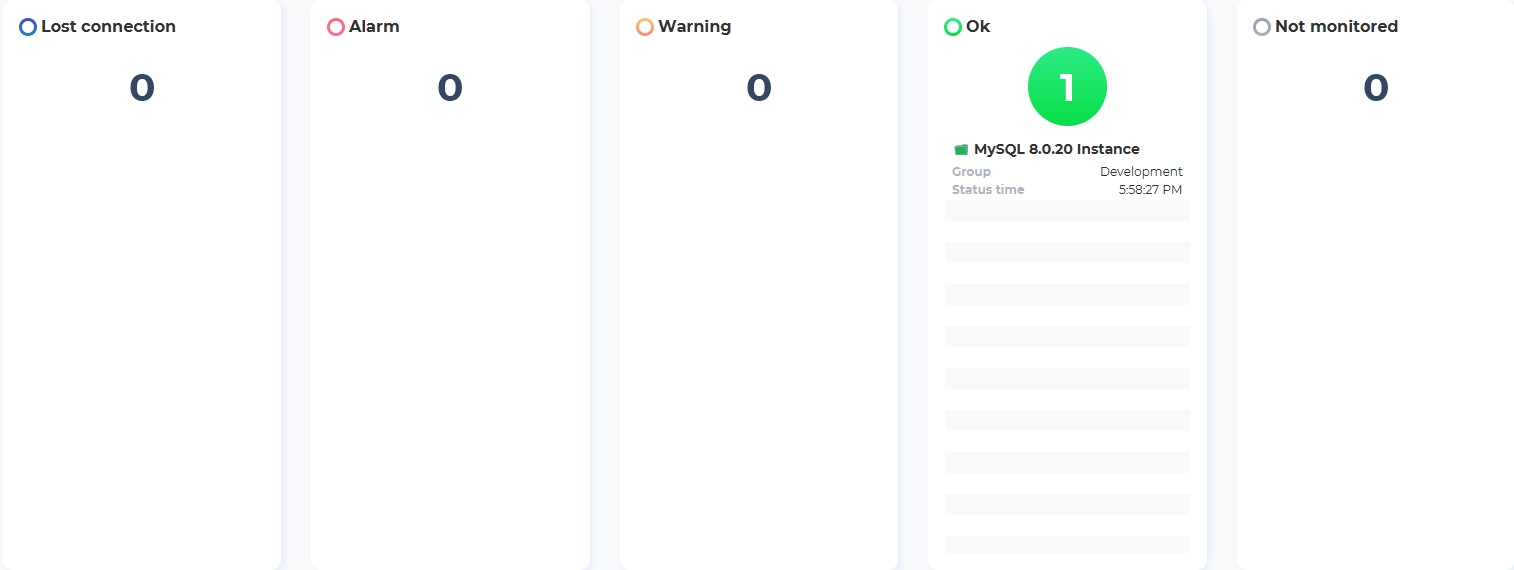

The index page lists database instances, their status, group, and last checked time. For example, databases with no issues are listed under “Ok”:
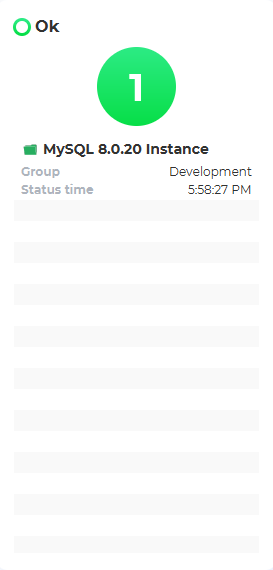
Instances with issues will appear under “Warning”:
Critical issues requiring immediate attention are displayed under the “Alarm” category:
Alternatively, head to the “Server” tab and click “Server States”:
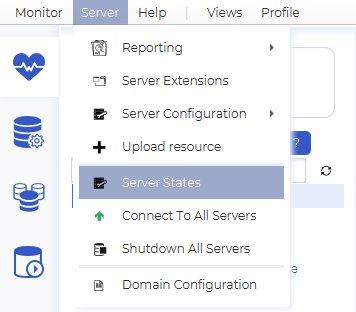
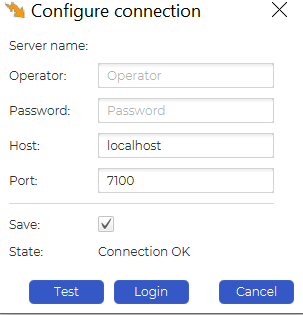
The menu provides options like trace route and server connection configuration:
Need to take notes or schedule optimizations for later? Use the notes area:

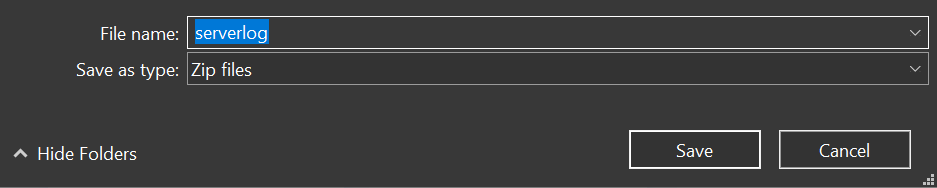
To access logs, select “Get logs” to download and extract the log files:
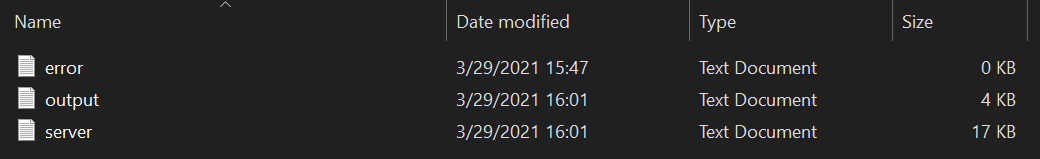
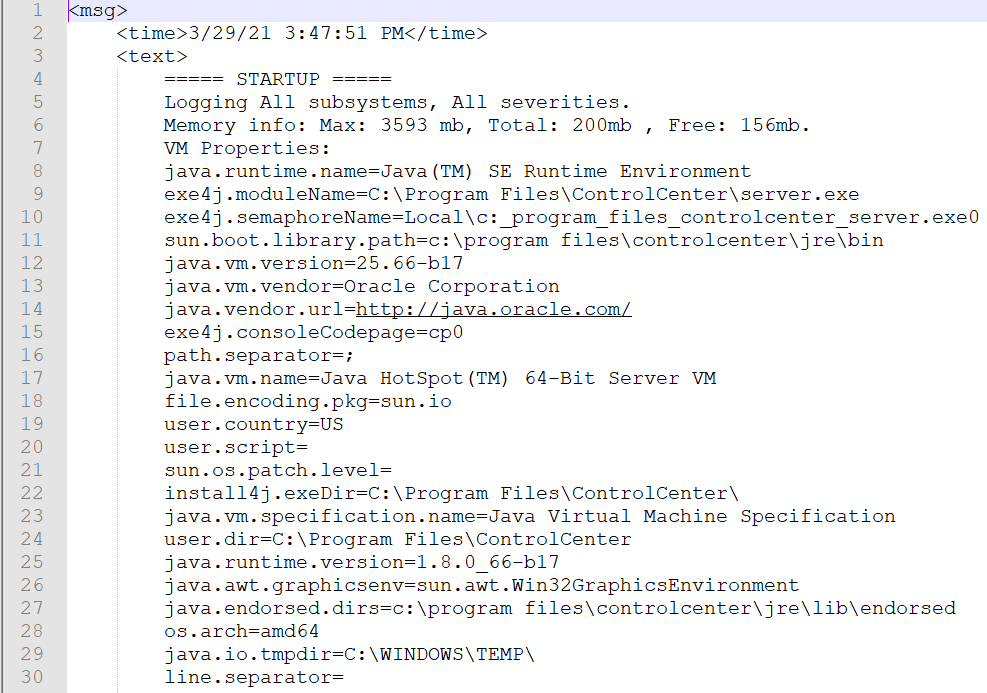
The logs (error logs, server logs, output logs) provide valuable information to troubleshoot issues. For instance, here’s a view of the server.log file:
Summary
Checking the health of your database servers is essential for optimal performance. dbWatch simplifies monitoring and troubleshooting across various platforms like MSSQL, Oracle, PostgreSQL, Sybase, MySQL, and Azure SQL. Utilize logs, monitoring modules, and configuration tools to keep your database environment running smoothly.
For more insights, visit the dbWatch blog.