
There’s a difference between checking your Oracle databases and knowing what’s happening inside them. Of course you’ll know when a problem hits and suddenly the database is down.
But are you catching problems early?
Are your alerts telling you what matters?
Can you explain what went wrong without digging for hours?
When using Oracle database monitoring tools across multiple environments, you need clarity to stay in control. This guide skips the basics and focuses on what matters: what you need to monitor, what the metrics tell you, and how the right tools help you act faster and more confidently.
Suppose you use built-in Oracle features like Automatic Database Diagnostic Monitor (ADDM), Oracle Enterprise Manager, or Real-Time SQL Monitoring. In that case, this guide helps you understand how external monitoring tools can complement and extend those native capabilities.
What You Actually Need from Oracle Database Monitoring Tools
Good monitoring gives you answers, not just alerts. It tells you what’s happening inside your Oracle instances, shows you what changed, and helps you connect symptoms to causes. Without that, you’re just reacting to problems without context.
Having the context means getting more than uptime checks or status screens. You need:
- Real-time visibility into sessions, queries, wait events, and resource usage
- Historical trends to detect slow changes and recurring issues
- Accurate, relevant alerts that match your environment
- Performance baselines that tell you when something is drifting
- A centralized view if you’re managing many instances or platforms
A monitoring setup that delivers this complete overview with context lets you stay in control. You spend less time chasing symptoms and more time working with clear direction.
This kind of monitoring also makes sharing performance history with your team or vendors easier. It helps others understand what changed during root cause analysis or escalation.
The Core Oracle Metrics That Matter (and What to Do With Them)
Every Oracle environment produces thousands of statistics, but not all of them are useful when you’re under pressure to resolve an issue or explain what went wrong. The key is to focus on a core set of metrics that help you understand workload patterns and detect problems early.
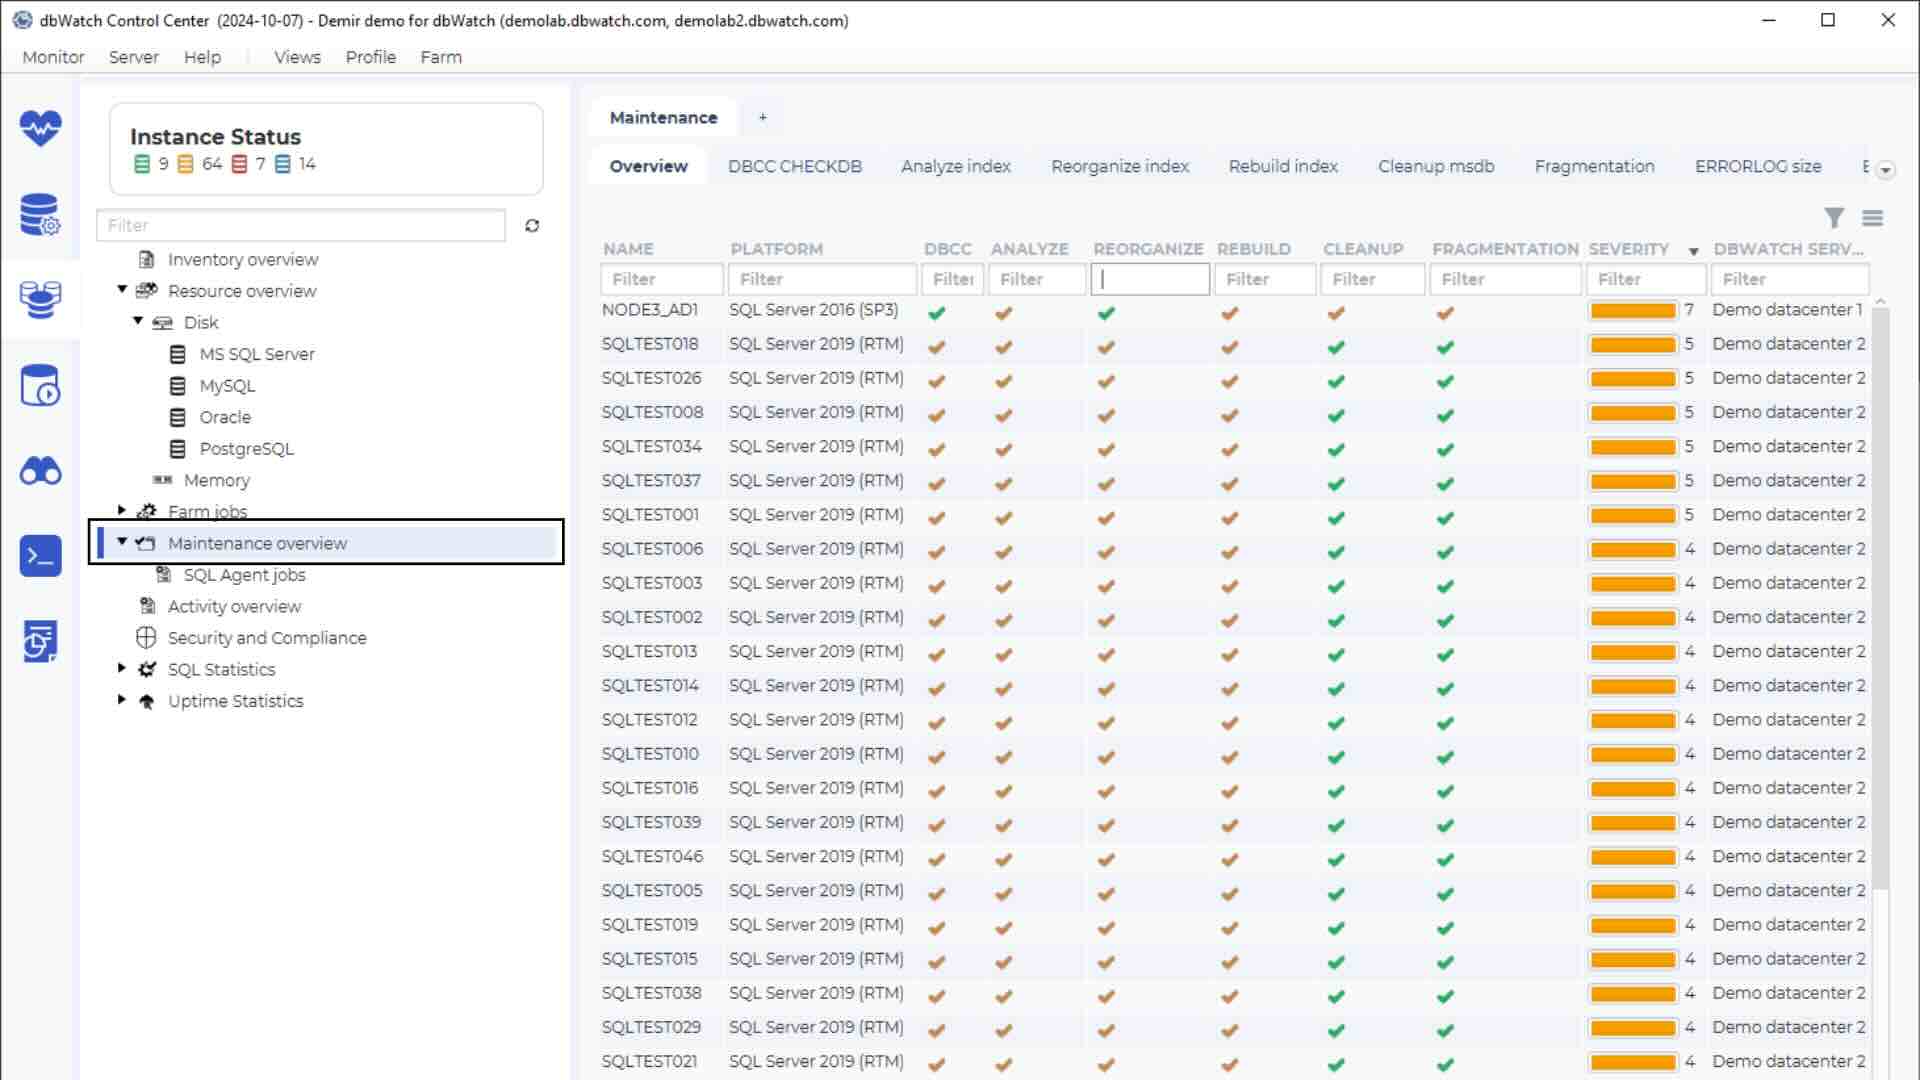
dbWatch Control Center is designed around this principle. Its job-based monitoring tracks the most critical metrics across your Oracle instances with historical views, thresholds, and alerts that support daily operations at scale. Each job targets a specific performance area, so you are purposefully monitoring, not just collecting data.
Below are the performance metrics that matter most, along with how dbWatch helps you monitor them effectively.
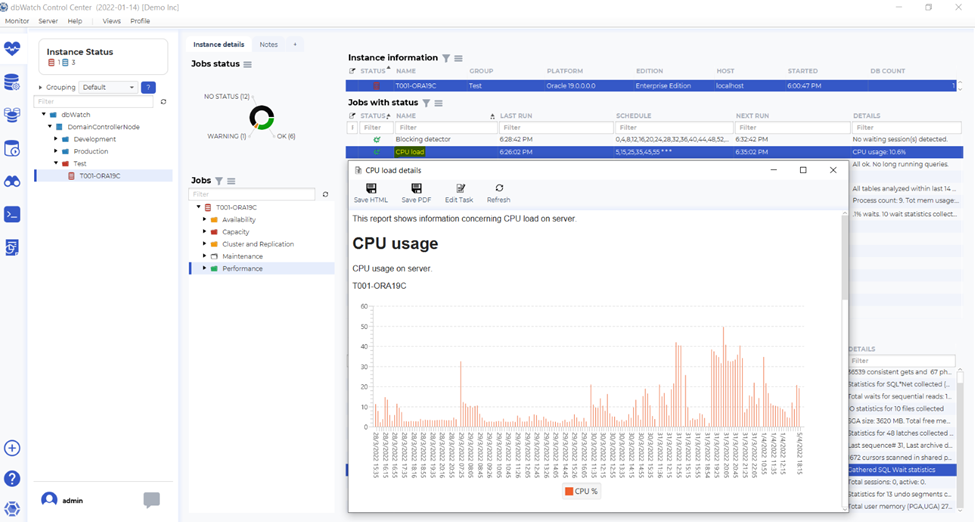
Sessions and CPU Usage
High CPU load often points to runaway queries, overloaded processes, or inefficient application behavior. Tracking CPU usage per session helps pinpoint which operations use the most resources and when spikes occur. dbWatch jobs let you set thresholds and alerts to stay ahead of performance degradation.
Long-Running Queries and Memory Usage
Sessions consuming memory for too long can create bottlenecks. Monitor memory usage per session to identify the SQL behind inefficient workloads. Jobs like Top User Memory Usage and Long-Running Queries highlight unusual activity and offer a starting point for optimization.
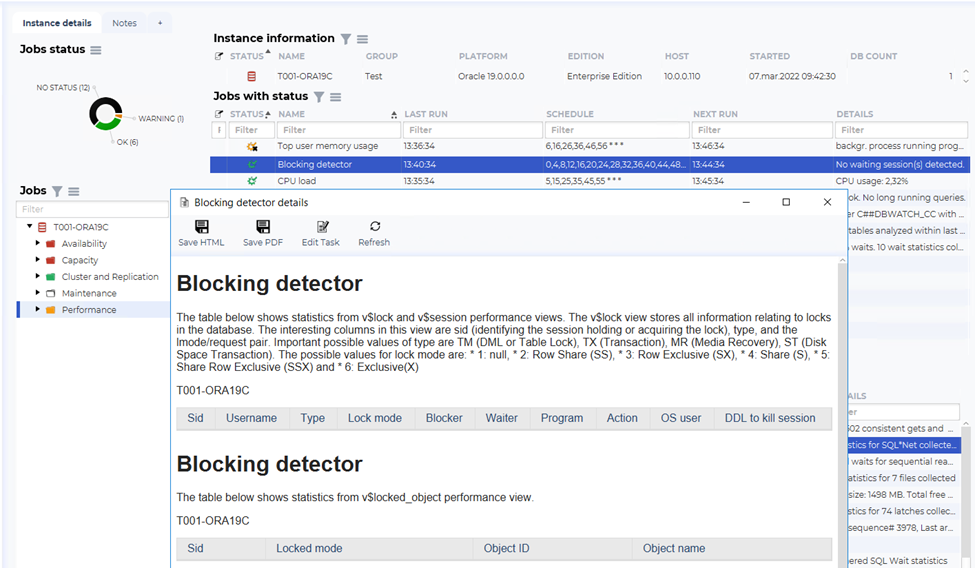
Blocking Sessions
Blocking occurs when one session holds locks needed by another. The Blocking Detector job identifies blocking chains, lock types, and responsible sessions. With alerting configured, you’re notified before blocks affect users.
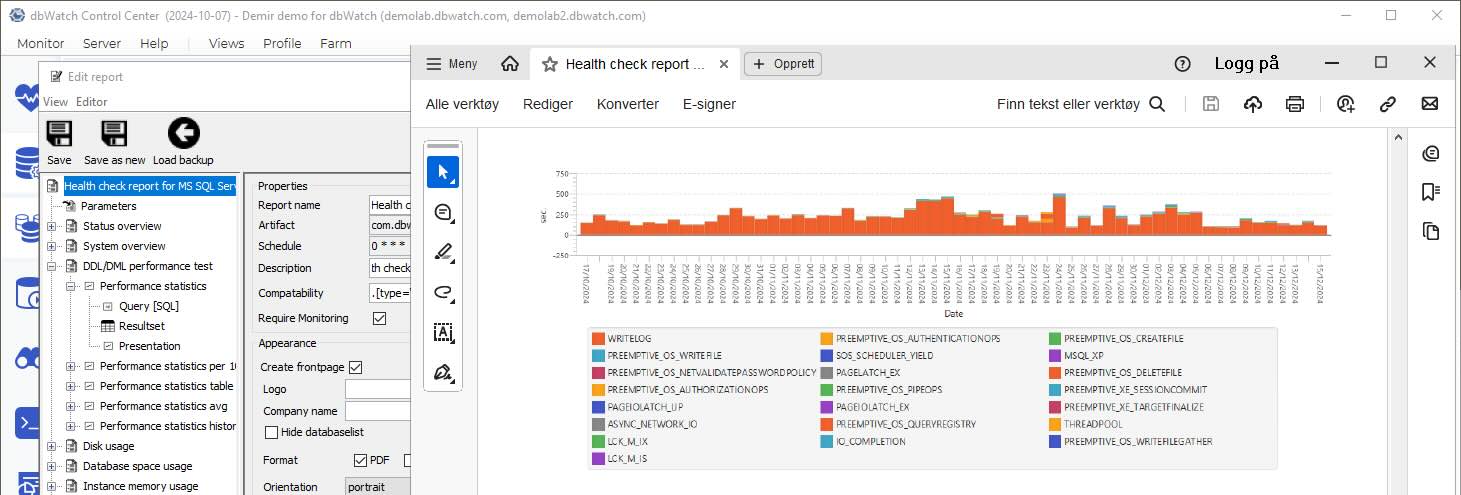
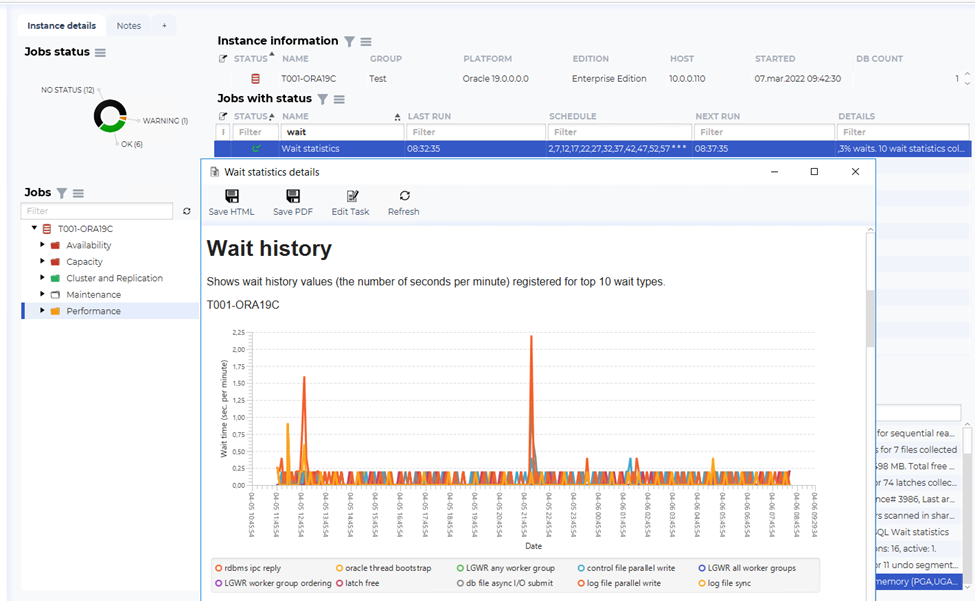
Wait Statistics
Wait events show where your system is losing time — I/O, network, or internal contention. dbWatch visualizes these trends over time, helping you see when and where performance is slowing down and what’s causing it.
Monitoring these metrics gives you the context to connect symptoms to root causes. This makes performance tuning, troubleshooting, and reporting much more targeted and effective.
Oracle Database Monitoring at Scale: What Changes When You Have 10, 50, or 200 Instances
When you scale, more Oracle instances call for a different workflow. You’ll need to consider what tools you need and how much visibility you need.
At scale, you need:
- Consistent monitoring policies across environments
- A single place to track all your Oracle instances (and ideally other platforms too)
- Shared alert thresholds that reflect how each system behaves
- Reporting and comparisons to spot anomalies without jumping between tools
- Lightweight jobs that do not overload systems with unnecessary overhead
With this setup, you stop bouncing between tools and start seeing patterns across environments. It helps you move faster and confidently respond to issues, even when managing dozens or hundreds of systems.
Comparing metrics across environments is especially useful when performance drops on just one instance. It helps isolate whether the issue is local, systemic, or resource-related. Cross-instance visibility also helps support capacity planning and platform standardization.
What Makes an Oracle Monitoring Tool Useful
Many tools can collect metrics. However, you’ll have to find the balance between what is helpful and what is so complex that it adds problems instead of solving them.
Many DBAs find it useful to have:
- Dashboards that reflect reality in real time
- Custom thresholds and alerting rules that match your environment
- Historical tracking so you can investigate after the fact
- Support for multiple platforms in one place
- Lightweight overhead so you are not adding to monitor load
- Clear reporting for team members, vendors, or audits
When a tool gives you this, monitoring becomes less about watching and more about understanding. You gain trust in the data, act faster, and return to higher-value work instead of manually rechecking everything.
If comparing options, look at how different Oracle database monitoring tools handle noise reduction, scalability, and cross-platform support. Tools like dbWatch are built specifically for high-instance environments and support Oracle alongside SQL Server, PostgreSQL, and MySQL.
How dbWatch Helps You Monitor Smarter
dbWatch Control Center is designed to help you manage Oracle database monitoring with more automation and greater clarity. It uses a job-based architecture that gives you fine-grained control over what you monitor and how often.
You can track:
- Session activity
- Wait statistics
- Blocking events
- Top SQL
- Resource usage trends
- Maintenance job history
These jobs are adjustable to fit your environment and can run across many instances simultaneously. You can also set up alerts, review history, and compare activity between systems without switching tools. dbWatch supports Oracle alongside other platforms giving you consistency across your database landscape.
You can auto-generate health check reports weekly to check your current state and track it over time. This gives you a deeper level of visibility and makes it easier to focus your time where it matters most. You respond faster, with more confidence, and with less friction in your workflow.
You will also have real-time issue response and historical insight. With both you can react quickly but learn from the past.
Best Monitoring Practices from the Field
Monitoring works best when it becomes part of your routine. A few practical habits can help you get better results over time.
Consider:
- Reviewing historical trends weekly to spot small shifts
- Tuning alert thresholds based on real usage patterns
- Keeping your alerting clean so the important ones stand out
- Using your monitoring data to inform maintenance and performance tuning
- Tracking recurring issues to avoid repeat investigations
When these practices are in place, monitoring becomes a tool that guides your decisions instead of just reporting problems. It gives structure to your daily checks and helps you stay ahead of what’s coming next.
Over time, these habits also help you build an internal knowledge base of issues and resolutions — giving your team a better understanding of what your Oracle systems need and when.
Finding an Oracle Database Monitoring Tool That Works for You
Effective Oracle database monitoring helps you understand what your systems are doing, not just whether they are up. When a performance issue appears, or a job fails unexpectedly, you can respond with data, not assumptions.
dbWatch gives you the tools to monitor Oracle at scale, across platforms, and with the clarity you need to stay ahead of issues. Structured jobs, real-time views, and historical tracking bring control back into your hands.