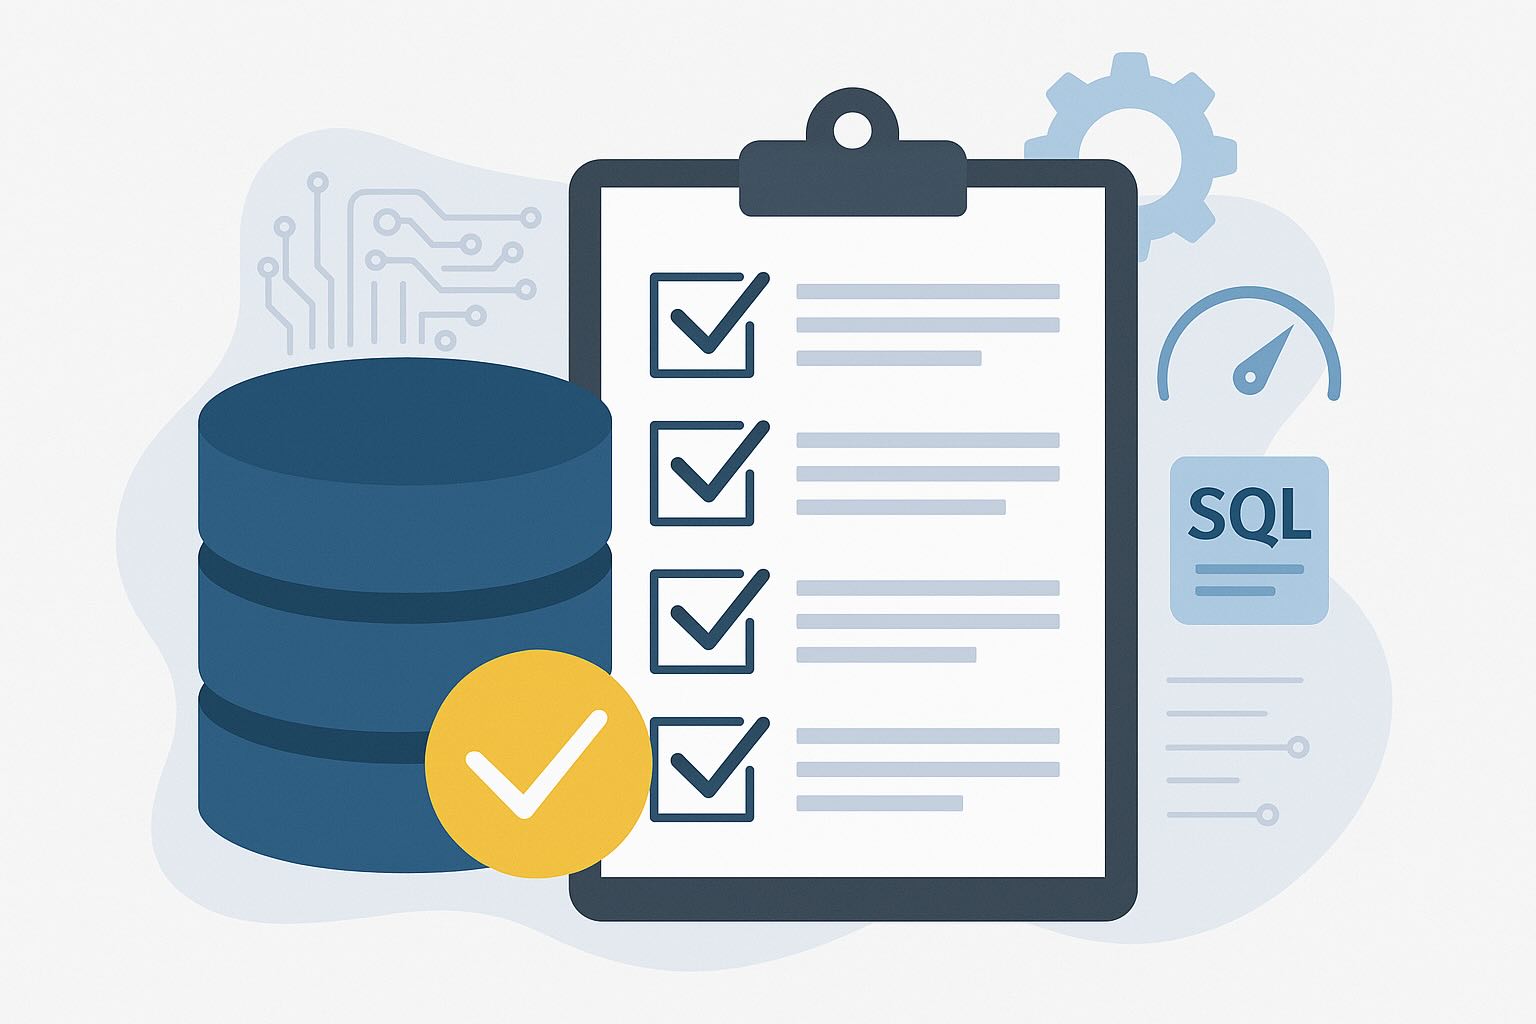


This Oracle database performance tuning checklist is built around real-world problems. Whether you’re facing slow-running queries, blocked sessions, or CPU overload, you can jump straight to the issue you’re dealing with and find clear steps to identify and resolve it.
Each section includes diagnostics, proactive actions, and how dbWatch helps you implement and scale these best practices across your Oracle environments.
- Slow-running queries
- Blocking sessions
- High resource usage (CPU, I/O, memory)
- Application-driven inefficiencies
- Maintenance gaps
Problem: Slow-running Queries
The classic. Something that used to run in seconds now takes minutes, and users ask why the app feels broken.
How to find it:
- Check top SQL activity
- Look at execution plans
- Drill down to session and resource usage
What to check:
- Are indexes missing or outdated?
- Has the dataset grown since the query was last tuned?
- Is it scanning a whole table when it should not?
Common trap:
You can spend hours tuning a query that’s only slow because stats are stale or a maintenance job didn’t run. Quiet performance decay is one of the hardest things to catch manually.
Proactive measures to identify slow queries:
- Review top SQL queries daily or weekly
- Track execution plan changes over time
- Keep stats up to date and monitor job health to support Oracle database performance tuning
With dbWatch:
dbWatch shows you the top SQL across all monitored Oracle instances, with links to execution plans, resource usage, and session context. You can compare performance over time and track how long a query has been a top consumer. If underlying maintenance jobs (like stats collection) fail or don’t run, dbWatch alerts you.
Problem: Blocking Sessions
Blocked or locked sessions also cause performance problems. For example, if a single session blocks or locks a row, everything else suddenly queues behind it.
How to find it:
- Look at the blocking session tree
- Review session history
- Monitor active sessions and wait for events
What to check:
- Who is blocking, and who is waiting?
- How long has the block been held?
- Is this caused by long-running batch jobs or poorly timed reports?
Common trap:
Without proper history, you only see what’s happening now. By the time you get involved, the block is gone, and the trail is cold.
Proactive blocking investigation measures:
- Monitor and log blocking history
- Flag repeat blockers or heavy DML workloads
- Coordinate long jobs to avoid conflict between workloads
With dbWatch:
dbWatch tracks live blocking sessions and records blocking session history, so you can analyze recurring issues even after they clear. dbWatch highlights which users and statements are causing lock contention, so you can understand blocking chains across sessions and databases. This helps reduce user impact and follow up with specific teams or developers.
Problem: High Resource Usage (CPU, I/O, Memory)
If you see a spike in CPU or disk latency, you have to find the problem quickly. Is the system suddenly maxed out? Questions start flying.
How to find it:
- Monitor system-wide CPU, memory, and I/O usage
- Correlate spikes with SQL activity and session load
- Look at performance baselines
What to check:
- Is there a query consuming more CPU than expected?
- Is the server under-provisioned for the current load?
- Are there hardware or virtualization limits affecting performance?
Common trap:
Spikes often get dismissed as “just a load issue,” but without detailed correlation, the real cause slips by — like an inefficient query or a missing index.
Proactive resource tracking measures:
- Use baselines to define normal usage levels
- Alert on abnormal resource consumption trends using your performance tuning policy
- Monitor top consumers and system bottlenecks together
With dbWatch:
dbWatch tracks resource usage trends per instance and across your environment. It links performance spikes to SQL statements, sessions, or jobs. You can compare metrics like CPU and I/O from one day to another, correlate them with workload changes, and prove whether a server’s capacity is the issue or if one query is overwhelming the system. It also helps confirm whether maintenance jobs are affecting performance windows.
Problem: Application-Driven Inefficiencies
You don’t write the SQL, but you’re still responsible when it slows things down.
How to find it:
- Review top SQL and session activity by application
- Capture who ran the query and from where
- Identify patterns tied to specific modules or reports
What to check:
- Are inefficient queries being generated dynamically?
- Does the query plan show excessive joins or full scans?
- Is this a recurring query or a one-time event?
Common trap:
Without the full context, developers won’t act. You’ll need to provide enough detail to get a fix. Remember to include query, time, plan, and impact.
Proactive measures:
- Track high-cost queries by application source
- Share actionable SQL performance data with developers
- Identify repeated performance offenders and assign ownership
With dbWatch:
dbWatch makes it easy to trace SQL back to applications, users, and source IPs. You can export query details, execution plans, and performance impact, giving developers everything they need to fix issues. Historical tracking also shows whether this problem is new or recurring, helping teams prioritize what matters.

Problem: Maintenance Gaps
Maintenance gaps often cause the most frustrating issues like slow performance, unexpected spikes, or gradual degradation. These small gaps, like a missed stats job or failed cleanup, tend to compound over time.
How to find it:
- Review job history and logs
- Correlate performance drops with missed maintenance
- Set alerts for failed or skipped jobs
What to check:
- Are stats being collected on schedule?
- Are index rebuilds happening regularly?
- Are old records or partitions being purged as expected?
Common trap:
Performance issues are chased from the top down — when they’re caused by something that quietly stopped running two weeks ago.
Proactive maintenance measures:
- Monitor job success/failure trends
- Get alerts when expected jobs do not run
- Schedule performance health checks
With dbWatch:
dbWatch includes detailed job monitoring that tracks when maintenance jobs run, how long they take, and whether they are completed successfully. You can set up alerts when key jobs are skipped or fail and tie these events back to specific performance issues. dbWatch makes it easy to ensure that your maintenance routines protect your performance, not quietly failing behind the scenes.
Final Thoughts: Oracle Database Performance Tuning Checklist in Action
Oracle database performance tuning doesn’t need to be reactive, inconsistent, or time-consuming. With a focused Oracle database performance tuning checklist like this, you have a repeatable process to tackle the most common issues — from query slowdowns to missing maintenance.
Combining structured analysis with proactive monitoring and automation builds confidence and reduces manual work. Whether maintaining one system or hundreds, these best practices help you protect your environment before problems escalate.
dbWatch Control Center supports your performance tuning workflow by making the data clear, the tasks manageable, and the response time faster.